As a chartist, I find it enjoyable to observe price movements in order to spot new pattern formations. The world of Bitcoin continues to be an exciting space for me, especially when I examine the trends and patterns present within the charts. Today, let me take a closer look at the recent happenings on Bitcoin’s 1W timeframe chart as I attempt to decipher potential future movements based on technical analysis (TA).
Fighting With The Relative Top Of January 11th
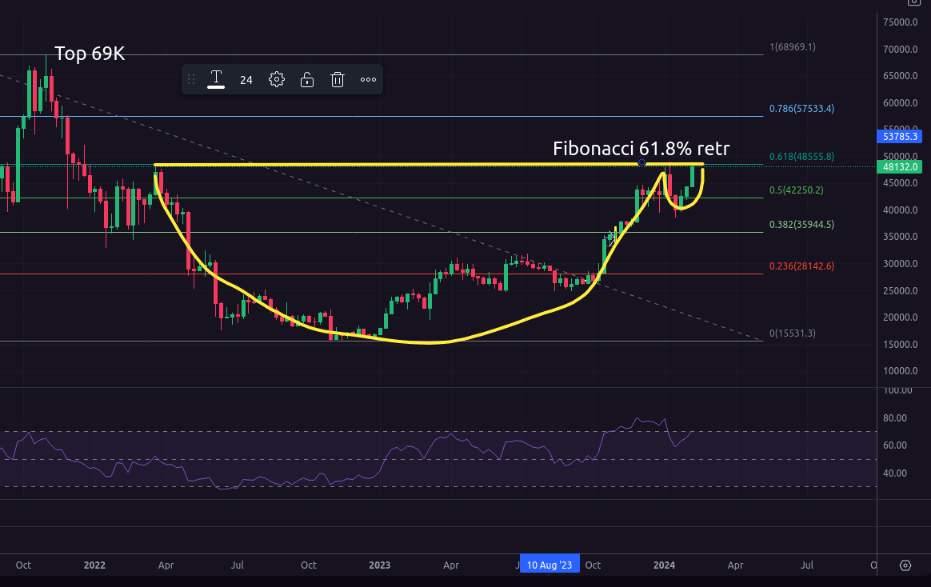
On January 11th, significant selling pressure was observed due to the announcement and subsequent launch of various Bitcoin ETF products. This “Sell the News” event resulted in a rejection around $48k, forming what appears to be a Double Top formation – a bearish signal. In this case, the two peaks reached near identical values, further strengthening its significance. Although initially perceived as potentially bearish, the market did not immediately validate such concerns, leaving room for another crucial development.
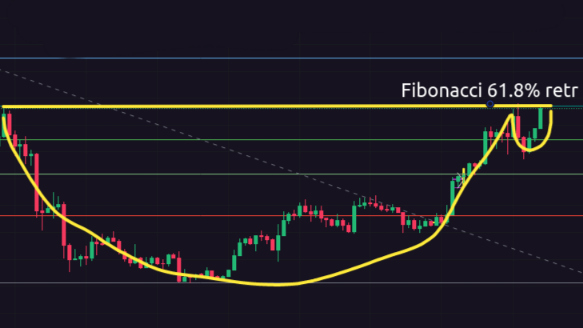
Exactly one month later, on February 11, 2024, the selling pressure subsided, allowing the market to recover. Prices rose steadily throughout the month, eventually forming the right side of the “Cup and Handle” pattern.
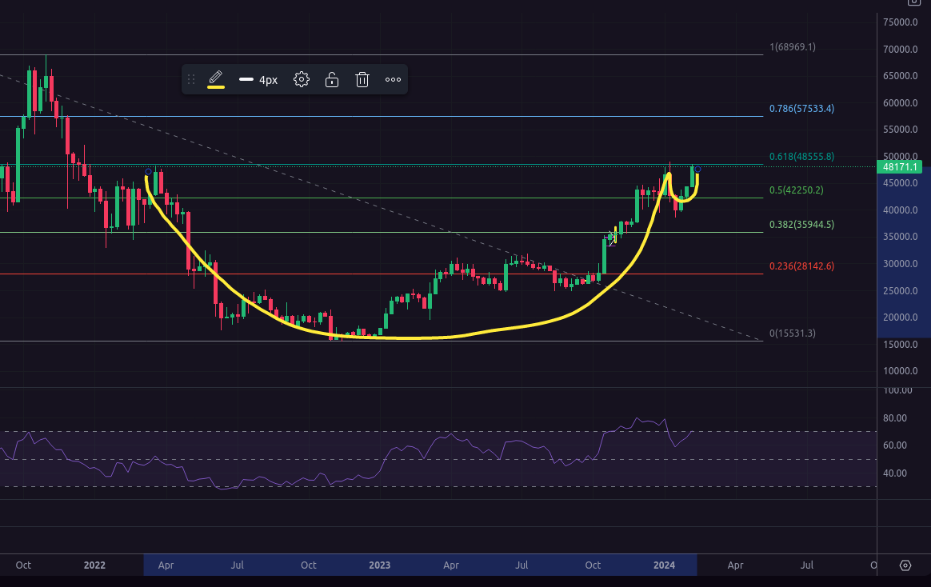
Coincidentally, the upper boundary of this cup corresponded to a critical Fibonacci retracement level of 61.8%, calculated from the all-time high of $69,000 achieved in November ’21.
Rejected By Handle And Cup Bullish Pattern
Currently, the price hovers just below the lip of the cup, hinting at either consolidation or preparation for a continuation higher. Indeed, there are plenty of reasons for optimism surrounding the current state of the Bitcoin market.
Various factors contribute to this growing positivity among investors. One major factor is the approaching Bitcoin halving event scheduled for April 2024. Historically, halvings have served as significant catalysts driving Bitcoin’s value upward. Thus, expectations remain high that history may repeat itself, fueling demand for BTC and boosting investor morale.
Last week saw consistent positive net inflows in the Bitcoin spot ETF market, demonstrating increasing demand among investors. Moreover, Grayscale’s GBTC reported a marked decrease in outflows, implying a shift towards greater accumulation, particularly amid relatively stable pricing.
Considering the historical performance surrounding pre halving events and the influence they exert over the broader market, it becomes increasingly plausible to maintain an bullish stance. Institutional players and seasoned traders may view the approaching halving as an inflection point, prompting them to enter strategic long positions and prepare for a potential upward trajectory.
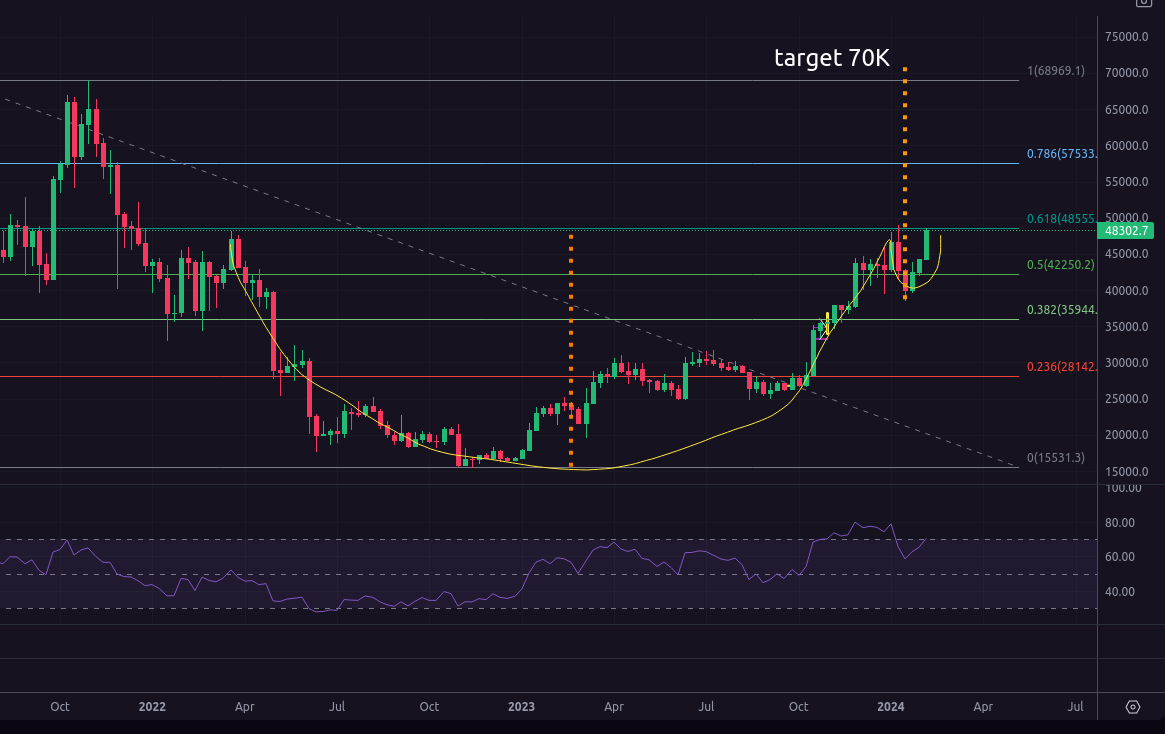
Additionally, RSI (Relative Strength Index) readings indicate a possible approach toward overbought levels around 70. Should both forms of resistance be breached simultaneously, one might anticipate a powerful upside breakout, potentially propelling the price toward the next significant Fibonacci retracement threshold of 78.6% at approximately $57,500 as a first target.
To recap our discussion, let us consider the psychology behind the prominent Cup and Handle pattern in relation to Bitcoin’s recent price movements. Investors tend to take profits as the price rises, generating selling pressure that results in a temporary downward spiral and price correction. According to studies based on over 900 trades, the reliability of the Cup and Handle pattern stands at a remarkable 95% success rate in bull markets, offering valuable insights into Bitcoin’s current behavior.
Indeed, the current weekly chart indicates that Bitcoin is striving to overcome a formidable resistance level. Should this attempt prove successful, we should expect a powerful surge in momentum, possibly elevating the price toward the subsequent Fibonacci retracement level of 78.6%.
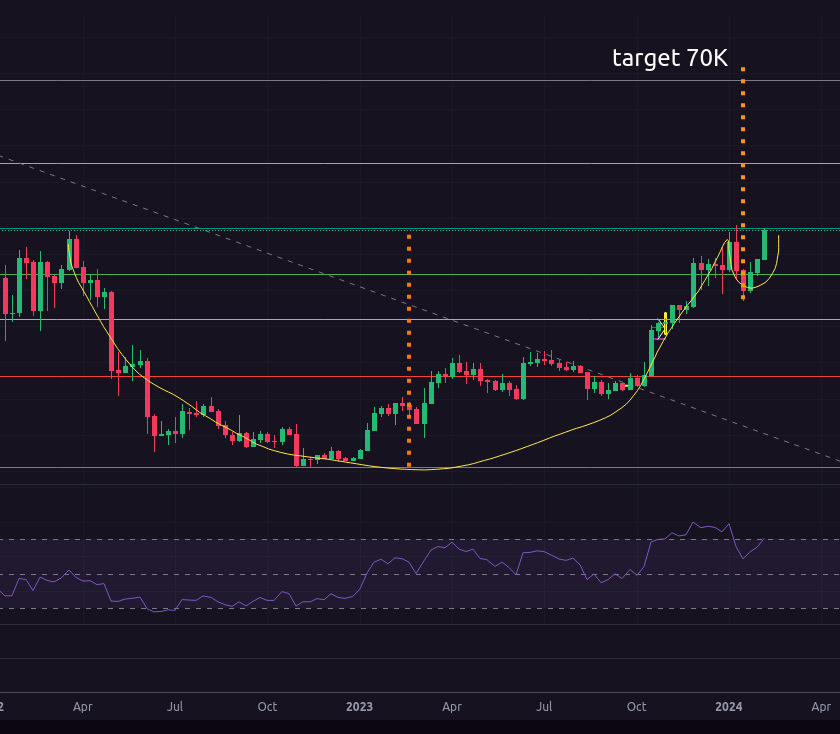
While estimating precise timing poses difficulties, considering the pending halving event in April 2024, speculation arises regarding whether the breakthrough will transpire before or after said milestone. Interestingly, if indeed a breakout does materialize, the projected target using the cup and handle pattern methodology reaches approximately 70k, implying that Bitcoin could even surmount its former all-time high of $69k.
Overall, combining the psychological aspects of the Cup and Handle pattern, its proven track record, and the influence of external elements such as the impending halving event paints a hopeful picture for Bitcoin’s future trajectory.
But always do your own research before investing! Happy trading!